Pre-holiday drift is one of the oldest folk theorems in market lore. The story goes: trading desks thin out, short-sellers don't want to carry risk over a long weekend, and the resulting bid-side imbalance pushes prices up into the close. The academic version traces back to Fields (1934) and was sharpened by Ariel (1990) and Lakonishok & Smidt (1988), all of whom found small but persistent positive returns in the last day or two before US market holidays.
Memorial Day is one of the cleanest holidays to test the theory on. It anchors a three-day weekend, falls in the “sell in May” seasonal window, and unlike Thanksgiving or Christmas doesn't share the calendar with a year-end tax effect. So: when traders say the market drifts up before Memorial Day and chops sideways after, is that actually true?
We pulled 36 years of S&P 500 daily closes (1990–2025)from Yahoo Finance, anchored each year's observation to the trading day immediately before Memorial Day, and compared the 5-day pre and post windows against 10,000 randomly chosen 5-day windowsfrom the same date range. The result is a story the data tells in two different voices — an interesting whisper, and a statistically honest shrug.
1. The setup
Memorial Day is the last Monday of May. The NYSE is closed that day, so any event-study has to choose an anchor. We use the trading day immediately before the holiday — the Friday close — as day 0. The pre window covers the five trading days ending at that close (Monday through Friday of the holiday week). The post window covers the five trading days starting Tuesday after the holiday and running through the following Monday.
- Universe. S&P 500 index (
^GSPC) daily closes from 1990-01-02 through 2026-05-22. 9,165 trading days, 36 full Memorial Day observations from 1990 through 2025. - Per-event measure. Cumulative 5-day return in each of the pre and post windows. Multiplicative compounding, not arithmetic sum.
- Baseline. 10,000 randomly chosen anchor positions from the same date range, with the same 5-day-pre / 5-day-post calculation applied. This is the "what does any random Tuesday look like" comparison group.
The reason for the random baseline is exactly the one that bites every seasonal-effect study: stocks have historically gone up. If you compute the average 5-day return of anyrandom 5-day window over the last 36 years, you'll get something positive. That doesn't mean Memorial Day is special. The interesting question is whether the Memorial Day windows are more positive than the random ones.
2. The average path around Memorial Day
Here's the average S&P 500 path across our 36 events, re-centered so day 0 (Friday close before the holiday) = 0%:
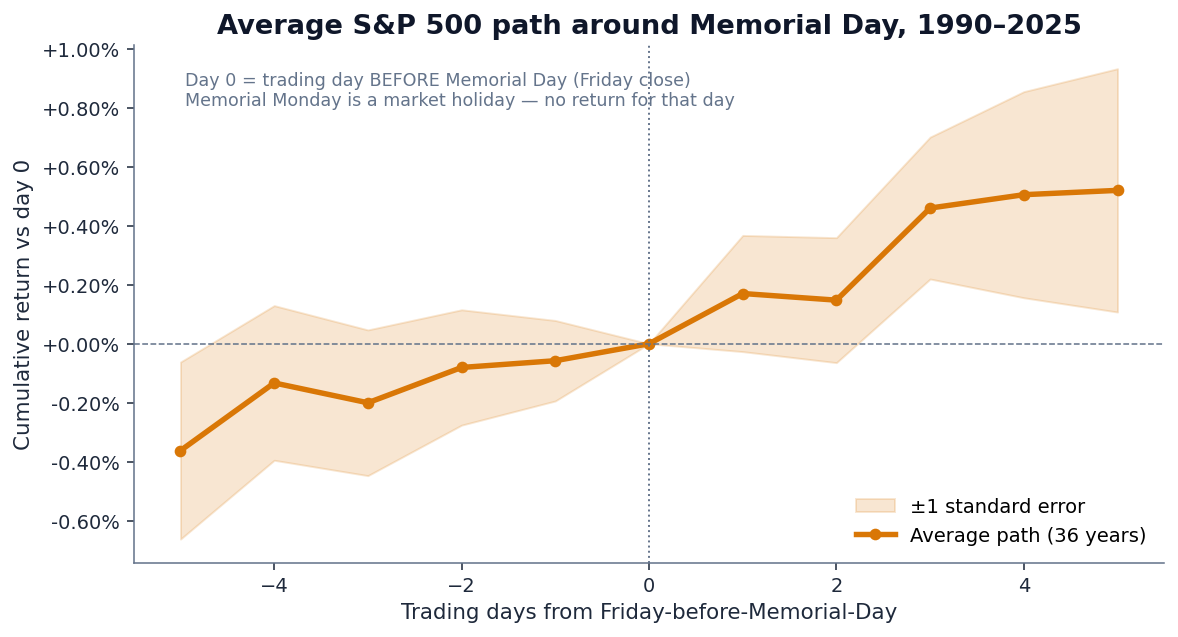
Two things to read carefully here. First, the line goes up. The narrative isn't wrong in direction. Second, the standard-error band is wide. The line is climbing through a fog where the true mean might be anywhere from −0.5% to +1.5% on any given day of the window. A bigger sample would tighten the band; we don't have one, because Memorial Day only happens once a year.
3. The per-year picture is messy
Averages hide the dispersion. Here's every individual year:
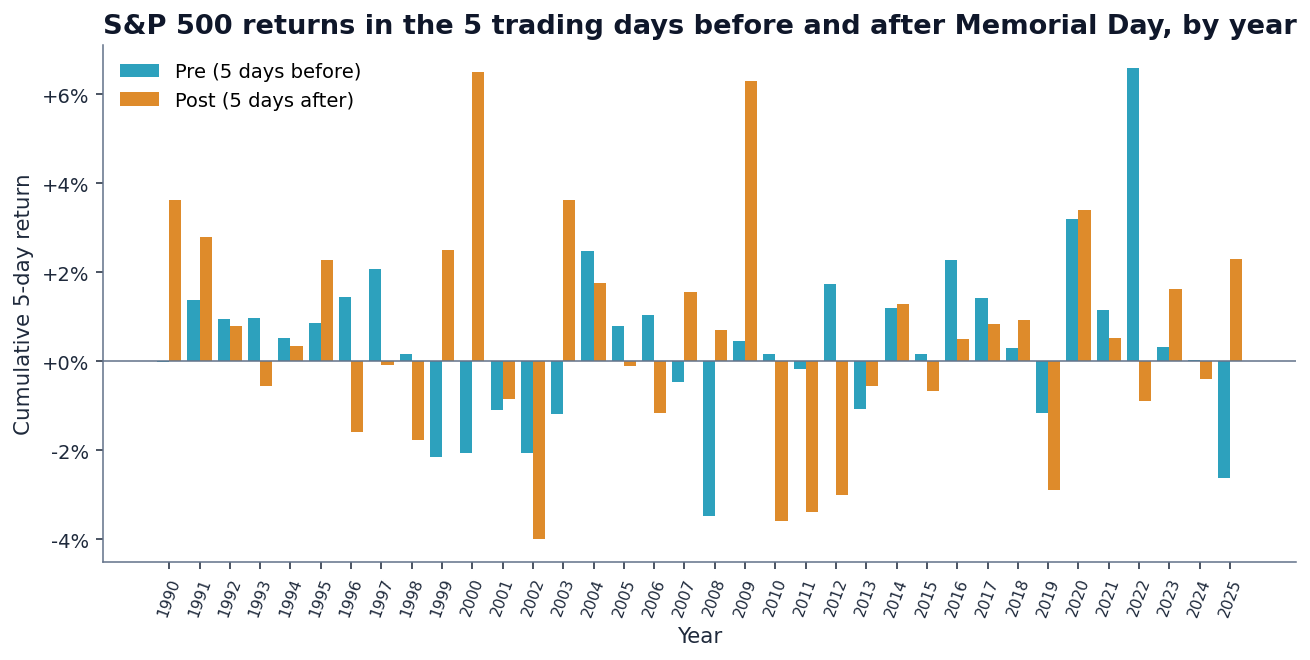
This is what 36 observations looks like when you stop averaging them. The biggest moves in either direction line up with named macro events (2008 GFC, 2009 recovery, 2020 COVID rally, 2022 inflation panic). That's a clue that whatever “Memorial Day effect” exists is small relative to the noise that the macro regime injects.
4. The honest comparison: Memorial Day vs random weeks
Here is where the test gets sharp. We drew 10,000 random 5-day windows from the same 1990–2025 date range and computed the same statistics. If Memorial Day is special, its distribution should shift meaningfully relative to the baseline. It doesn't:
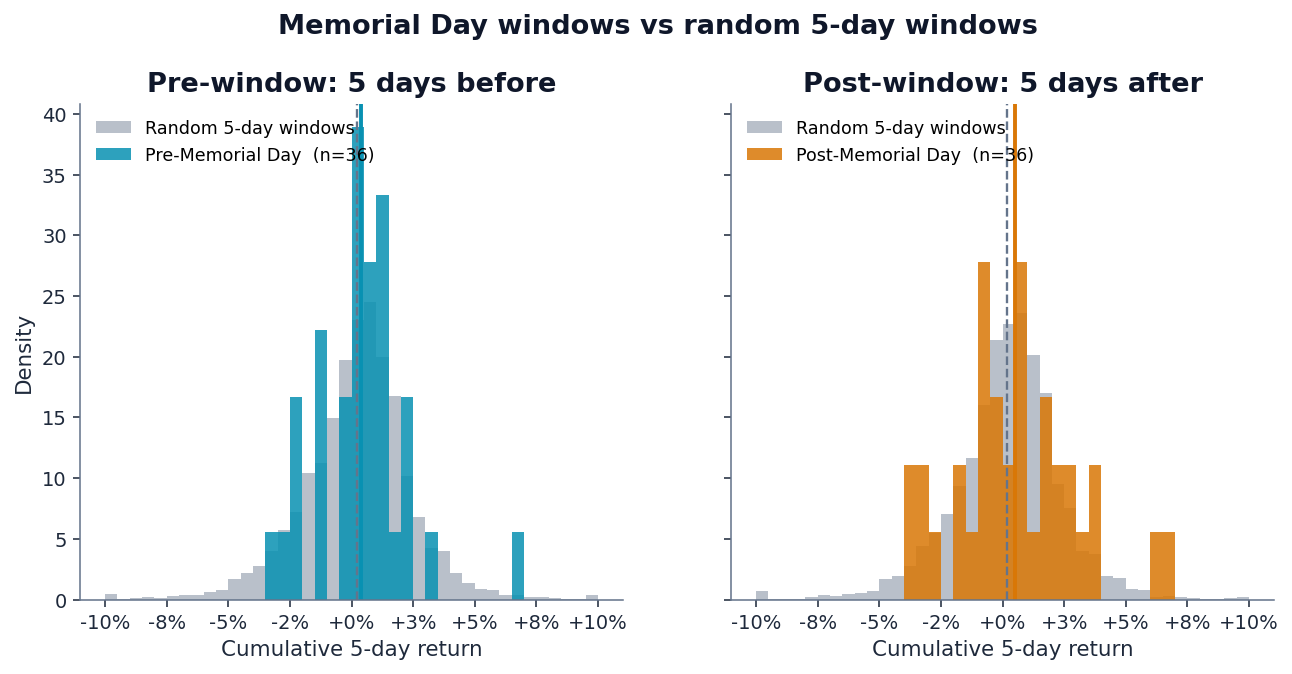
Translation: if you ran this same study using a different US holiday with no folk story attached — or, for that matter, simulated Memorial Day as “the last Monday of a randomly chosen month” — you'd see comparable differences from baseline a large fraction of the time. The pre-Memorial-Day rally is real in our data, but it is not statistically distinguishable from the rally you'd get from any other randomly chosen Friday in the last 36 years.
5. Hit rates: where the whisper lives
One number is mildly intriguing — the pre-window hit rate, the share of years that closed up over the 5 trading days into the holiday:
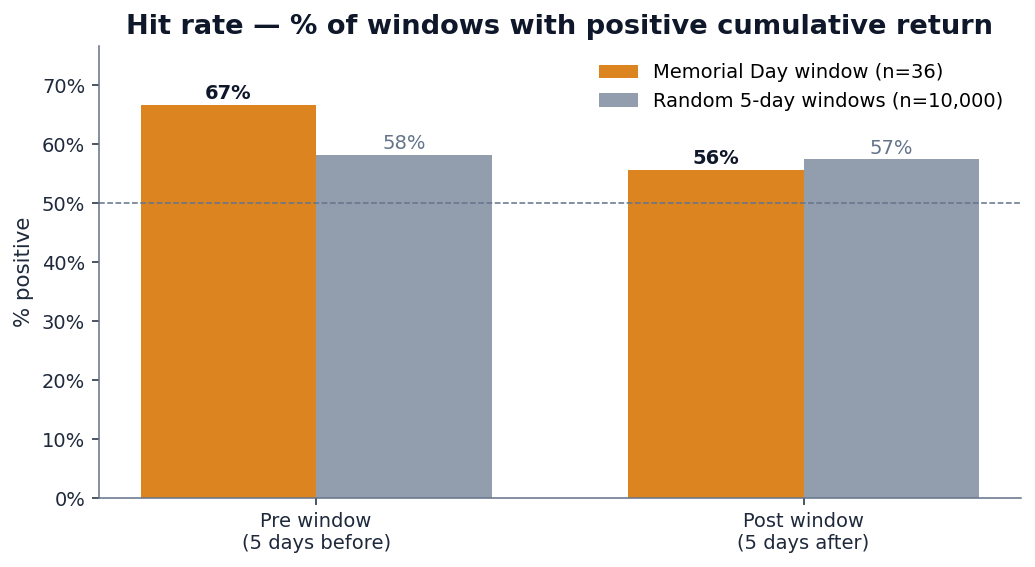
67% is the most distinctive number we found. It's the closest the data comes to telling a "yes, this happens" story. But two-thirds of 36 is 24 — we're looking at a baseline of 58% and asking whether 24 wins is meaningfully more than the ~21 wins we'd expect by chance. The answer is “maybe.” That's not a tradeable edge. That's an observation worth filing under interesting if confirmed by another 50 years of data.
6. The honest read
Three things are true at once, and they don't cancel out:
- The direction matches the folklore.Both windows are positive on average. The pre-week is up two-thirds of the time. If you asked a trader to guess the sign of the S&P 500 over the week before Memorial Day, they'd be right more often than wrong, and they'd be right more often than the calendar baseline.
- The magnitude is small and the sample is tiny.A 0.40% mean over 5 days, in front of an annualized realized volatility of ~16% (or ~2.4% per 5 days), gives you a Sharpe-style ratio per observation of roughly 0.16. Multiply by √36 / 12 to annualize across years and you're sub-1.0. That's before transaction costs, slippage, and the cost of capital tied up waiting for a single window per year.
- The within-sample t-stat is 1.30, the test-vs-baseline t-stat is 0.62, and the p-values are 0.20 and 0.54. Neither passes the conventional t > 2 / p < 0.05 threshold. If this were submitted as a finance paper, no journal would accept it as evidence of an effect. The right description isn't “the Memorial Day rally is dead.” The right description is “36 observations isn't enough data to claim there ever was one.”
Pre-holiday drift studies covering many holidays at once typically find somesmall effect — Ariel (1990) reported pre-holiday returns about 9× daily averages on a much larger pooled sample. A single-holiday slice like ours has far less statistical power. Our finding of “positive but not significant” is what a small sample of a small effect looks like.
7. Why QScoring doesn't score this
This whole study is, in a sense, the empirical justification for what QScoring deliberately leaves out. We didn't build a calendar-effect factor for the same reason we publish factor t-statistics with our methodology page: anything that can't survive a real statistical test shouldn't be in the model.
- Calendar effects don't survive out of sample. Almost every paper on the pre-holiday drift, the January effect, or the Halloween indicator finds that the size of the effect drops — often to zero, sometimes to negative — after the paper is published. The hypothesis is that publication itself arbitrages the effect away. The empirical reality is that the effects were always marginal, and statistical noise was generous enough to make them look real for a few decades. That's why our S&P 500 factor backtest insists on long-run windows and reports the unflattering t-stats.
- The QScore is built on durable factors with deep academic records.Value, growth, momentum, profitability, and risk — the five categories described in how to read a QScore — have empirical records measured in decades, across countries, across asset classes, with t-stats well above 2 even after publication. A 36-year sample of one calendar event simply isn't in the same evidentiary category.
- A 0.40% expected return is not actionable.Even if the pre-Memorial-Day drift were real, the round-trip cost of putting on a one-week position and unwinding it — commissions, bid-ask spread, market impact for any non-trivial size — would eat most of it. The strategies that look great on paper but die after costs are the same ones we discussed in the credit-card fraud post: the headline metric flatters before you confront the economics of actually operating it.
The right way to use a study like this isn't to trade the week before Memorial Day. It's to internalize how easy it is to find a plausible-looking pattern in 36 observations, and how often that pattern evaporates the moment you ask it to clear a statistical bar. The QScore framework is the answer to “what would we want from a signal that is notthis” — large sample, mechanically clear construction, t-stats reported honestly, factors that survive sector-normalization and out-of-sample validation.
Related reads
- Do stock factors actually work? Testing momentum, low volatility, and reversal on 5 years of S&P 500 data — the equity-side companion to this post: same statistical discipline, applied to factor signals that have a real academic record
- How to read a QScore — the five-factor breakdown that underlies every published score
- Predicting loan defaults — the credit-side analogue of "your model can clear AUC and still be telling you nothing"
- Methodology— full QScore construction disclosure, including the long-run IC and quintile-spread numbers we trust enough to publish
- Live scores— the daily-updated QScore for every covered ticker
- Reproduce this analysis on GitHub — full Python pipeline (
analysis/memorial_day_effect.py), charts, and the per-year metrics JSON
Discussion
Comments are powered by GitHub Discussions. Sign in with GitHub to join the conversation.